Changing Landscapes: A Great Release

Release date was finally here. I woke up in a panic just before 6am because I fell asleep before John sent me the PDF of the report to be posted to the website. I posted the report, double checked to make sure everything was in order, and then visited NJ.com to read the article. I knew that the article was limited to around 500 words, but I was still hoping for the best. (An aside: why aren’t all newspapers considering a brief short version and a longer web version for their articles? It’s not like there’s a restriction on word count on the Web.) The article was there and it was pretty good, all things considered. But, there was an egregious omission – a link to the report.

Continue reading

Posted in In the News, Web Mapping | Tagged , , , | Comments Off on Changing Landscapes: A Great Release

Changing Landscapes: A Million Little Tiles

A view of "Camelot" a residential development in New JerseyThe New Jersey Land Change Viewer, the online component of the Changing Landscapes research project required the generation of approximately one million map tiles. These tiles needed to be served quickly – the online viewer is meant to make the findings of the project and the ramifications of New Jersey’s urbanization patterns readily apparent to the general public. Long wait times do not help get your point across, so we used Amazon Web Services to store and distribute the map tiles.

Continue reading

Posted in Aerial Photography, Data, In the News, Technology, Visualization, Web Mapping | Tagged , , , , , , , , , | 1 Comment

Changing Landscapes: Brainstorming

This gets the GIS geeks excited.

Back in June, the New Jersey DEP Bureau of GIS released the 2007 Land Use/Land Cover data. The data was released in record time, just slightly over 3 years from the aerial photography date. We felt that we needed to release our findings as soon as possible after the release of the data. Before the data was released, John and I began discussing ways that we could make the data presentable to the public in a much more engaging manner than static maps in a PDF report.
Continue reading

Posted in Data, Google Maps, In the News, Technology, Visualization, Web Mapping | Tagged , , , , , , , , | 2 Comments

Release of “Changing Landscapes in the Garden State”

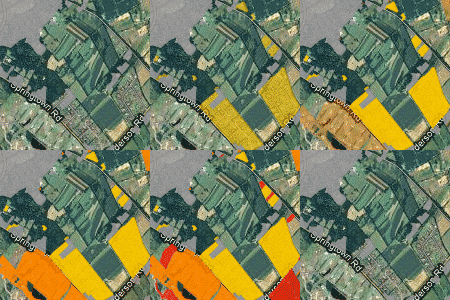
animation of the progression of urban developmentJohn Hasse and Richard Lathrop have been studying land use change in New Jersey since 2002. Their previous reports have been the impetus of many discussions on urban sprawl, environmental protection and resource planning in New Jersey. The reports themselves were released shortly after NJ DEP released their updates to the statewide land use/land cover data. This data set covers 1986, 1995, 2002 and released just one month ago, 2007. Over the past month, I’ve been working on the report’s website, hosted at Rowan on our GIS server. The last month has literally been a blur as we’ve worked to get the data for the report together and then into a series of interactive, animated web maps that show the progression of urban change over 21 years. Over the next few days, I’ll be posting a series on the project, from inception through implementation to release. I feel proud at my accomplishment – within one month I managed to prepare all the data, render and store it on Amazon Web Services, and develop a simple framework for animating a tile-based web map. I hope to be able to detail the process so that others may be able to do the same. If you have not done so already, please check out the report’s website and leave feedback and questions in the comments below. I’ll try to answer any questions about the projects in the subsequent posts.

Posted in Data, Google Maps, Planning, Visualization, Web Mapping | Tagged , , | 2 Comments

ArcGIS Editor for OpenStreetMap

ESRI has just released an add-in for ArcGIS 10 allowing ArcGIS users to download data from and contribute to OpenStreetMap. Marten Hogeweg announced the tool and news spread pretty quickly. While I agree with the favorable reception the tool has received, it’s still in need of work. Having said that, I must also say that this is the first tool I’ve come across that reliably downloads OSM data into a geodatabase based on a user-defined extent. Coupled with a basic symbology tool, it provides very easy access to OSM data. The average GIS user is not one that is necessarily comfortable with XML-formatted data; they want “a shapefile” and this tool delivers that. The retrieval by extent functionality is very important – in a state like New Jersey where we have 566 small municipalities, a GIS user in a borough or even a county would be inclined to download just their area of interest. The statewide shapefile downloads provided by CloudMade left something to be desired.

While the download functionality is pretty straightforward, the workflow to contribute edits back to OSM is a little convoluted. I’ll take you through the process as I downloaded a portion of Rowan University’s campus and updated OSM with some recent changes on campus. First, I opened a new map document, added in the 2007 aerial photography (for reference) and set my coordinate system to NJ State Plane in feet.

Getting Started

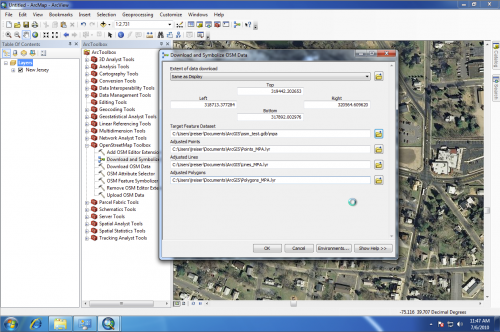
Starting out with the bare minimum is worth commenting on. All you need to get started is a geodatabase. The tool will even create the feature dataset in which the point, line and polygon feature classes are stored. I created a file geodatabase and started the “Download and Symbolize OSM” model, which does pretty much what it says.
Download and Symbolize OSM Data dialog in ArcGIS 10

Download and Symbolize OSM Data

With both the Download tool and the Download & Symbolize model, you can specify an extent and the tool will only retrieve data intersecting or contained by that bounding box. The script allows you to work in your native projection system, as the extent values are converted into WGS 84 coordinates. You then specify a name for your new feature dataset (different from most 9.3 tools, where the tool expects it to already exist) and the names for three symbology layers.
Posted in ESRI, In the News, OpenStreetMap, Tools and Scripts | 3 Comments

ArcGIS available on the iPhone

ArcGIS on the iPhone

ArcGIS on the iPhone

ESRI has released ArcGIS for iPhone. It’s now available through the App Store. It’s an iPad/iPhone app, so it should work well on both. I just tried it out on my iPhone, and it’s pretty snappy. The data loads quickly and the interface is clean. There are many layers already available through the app, such as OpenStreetMap.

I like the support for ArcGIS Server, as we will be able to provide our local data to iPhone users. I hope that a later revision will also support WMS, as there are many more free and useful WMS-based services out there than ArcGIS services. Greater support for GPS would be useful. ArcGIS for iPhone can locate you using the embedded GPS, but I don’t believe you can use the GPS to record features. I believe these features will come. James Fee points out that ESRI’s response to the UC FAQ regarding iOS support is positive, claiming that updates will feature editing and geoprocessing. As much as I prefer to edit on a big, widescreen monitor, it would be nice to update my data on the go.

If you have an iPhone or iPad, download it for free from the App Store and check it out.

Posted in ESRI, OpenStreetMap, Technology | Tagged , , , , | 1 Comment

Projects featured on Rowan’s home page

I’m proud to say that I now have two articles written about my work that have been featured on the Rowan University home page.

Mapping the Guard - view of tank

Most recently, Mapping the Guard (still on the home page) was posted, detailing the great work performed by students for the New Jersey National Guard. I’m very pleased to be heading up this internship program, because I feel that the students leaving the program will be excellent candidates for GIS positions. The students are learning about SDSFIE and other data schema, how to edit data in a multi-user environment, and working with web-based GIS services.

Way back when I was still an adjunct, Mapping the Campus in Layers was written. It’s a good read, because now that I’m at the University full time, I’ve worked to put the pieces together so that we can do much more.

Check back within two weeks about one of the projects we’re working on now. It might not be front-page material, but I’m sure you’ll find it interesting.

Posted in Data, New Jersey State Atlas, Teaching, Technology, Web Mapping | Tagged , , , , , | Comments Off on Projects featured on Rowan’s home page

More on Apple’s mishandling of geotagged photos

In my previous post, I claimed that iPhoto was the culprit behind the mangling of the GPS coordinates embedded in my photographs. The problem likely lies in the Core Image library used throughout Mac OS X.
To see if other image editing applications exhibited the same geotagging flaw, I used a jpg right off of my camera and rotated and saved it in Preview, Apple’s default image viewer. This demonstration shows that the method used to write .jpg files alters the GPS coordinates stored in the EXIF metadata. Continue reading

Posted in Apple, Data, Mac OS X, Technology | Tagged , , , , | Comments Off on More on Apple’s mishandling of geotagged photos

Script: Geotagged Photos to GIS

One of the data deliverables to the NJ National Guard as part of our GIS Internship program is photo and video documentation of the state’s Readiness Centers. There’s even a SDSFIE (a somewhat complicated, cumbersome data schema) entity type specifically for the location where photographs were taken. (Aside: it’s not surprising that “photograph_location_point” is in SDSFIE, because it seems like everything is in SDSFIE.) We have some cameras that have integrated GPS, so we’ve used them for documenting the field work. The problem was, “how do we get geotagged photos into GIS?”

I think it’s somewhat ridiculous that ArcGIS Explorer has the ability to add geotagged photos to the map, but ArcGIS Desktop doesn’t have a built-in means of recognizing geotagged photos. ArcCatalog already examines JPGs it finds for additional information in the case that the JPG is a spatially-aware aerial photo or a rectified map. Even a tool for creating a feature class out of geotagged photos would be great. Continue reading

Posted in Data, ESRI, Visualization | Tagged , , , , , | 8 Comments

Apple iPhoto rounds GPS coordinates to nearest second

I’ve been working with geotagged photos for the last few weeks as part of our GIS Internship Program with the NJ National Guard. One aspect of our data gathering at each of the state’s Readiness Centers is to photo-document the site as we collect data. All of the data recorded for the facility is stored in a SDSFIE-compliant geodatabase. One of the thousands of SDSFIE entity classes used to organize the data is “photograph_location_point” – a schema specifically for recording geotagged photographs.

We recently conducted field work at the installation in Woodstown, NJ and I took along my Nikon Coolpix p6000 – with integrated GPS. Since I’ve gotten the camera, I’ve been taking plenty of pictures with it and have been pleased with the results. The pictures are of a great quality and the GPS coordinates are usually in the 1-10m range. I took about 150 pictures while the students were collecting data. Using my mobile office, I downloaded the photos into iPhoto so we could discuss the work being done. I exported the pictures from iPhoto using the Export functionality and saved them to our workgroup server.
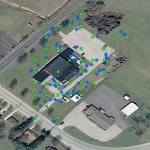
An example image showing the GPS locations for unaltered pictures  captured with a Nikon Coolpix p6000 and altered photos exported from  iPhoto.

"Rounded" and raw positions of geocoded photos.

This past week I’ve been working on a Python script* to take a directory of geotagged photographs and produce a point shapefile with the location of each picture and a path link back to the source photograph. I tested the script out on my Woodstown pictures and was conflicted: I was happy the script was doing what I wanted, but I was very disappointed with the results. It seems like  the geotagged photo points were all snapped to some imaginary grid. In fact, they were! iPhoto’s export function apparently rounds the seconds value (of degrees, minutes, seconds of latitude or longitude) to the nearest whole number. In doing so, it essentially snaps all of the coordinates to a grid with a spacing of 1 second, or around 100 feet. This clearly is a problem, as the most GPS units today are much more precise. The image at left demonstrates the difference between photos exported from iPhoto and the original images from the camera. Green squares represent the point shapefile based on the exported-from-iPhoto images and the blue circles represent the unaltered images. Except for two or so misplaced points, the blue circles accurately represent my position when taking the photograph within 15 feet.
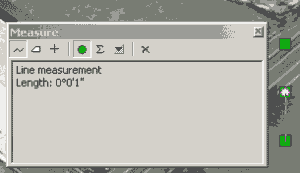
Measuring the distance.

Measuring the distances between the rounded points clearly shows that the location information is improperly exported from iPhoto and the coordinates are being rounded. iPhoto does not by default include GPS Exif tags in exported images, presumably to preserve privacy. Regardless, if the “Export Location Information” checkbox is checked, why should iPhoto even touch the GPS info? I would think it should pass the Exif tags along without molestation.

I really hope that this is a bug on Apple’s part and that they don’t assume that integer seconds ought to be enough for anybody. Until they do fix the bug, we won’t be able to edit our photos using iPhoto and retain accurate coordinates.

* I intended to release the script this weekend, but realized that I did not include any documentation in the ArcToolbox file. Once I add some documentation to the tool, I’ll put the script online and add links to this post.


Posted in Data, Technology | Tagged , , , , | 4 Comments