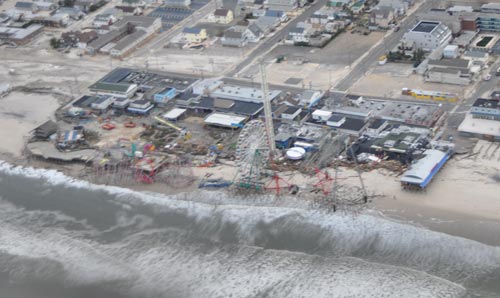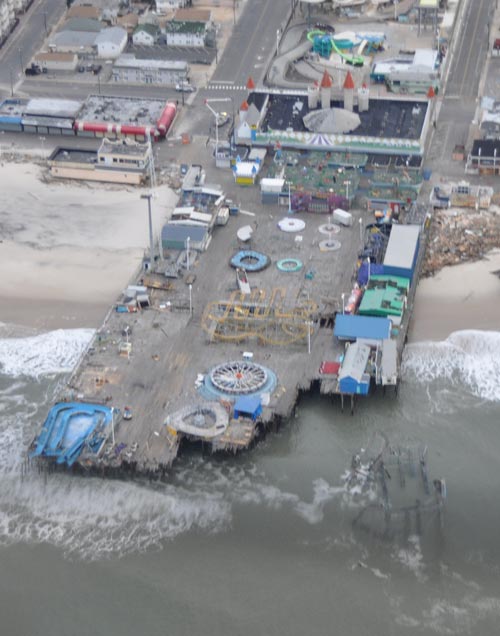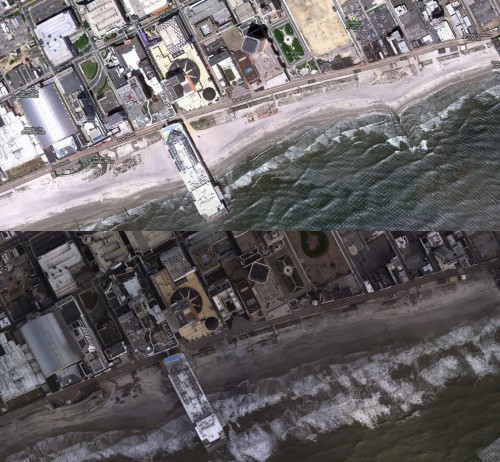
detail of the NJ Statewide Bicycle Map.
This Thursday, May 10th, I will be attending the final public meeting to discuss the draft New Jersey Statewide Bicycle Map and Resource Guide. I attended the first meeting at Cumberland County College, but will be again providing comments at this final meeting to be held at NJ DOT Headquarters. I’m very much a single-use public commenter, as I really do not have many concerns about the map at all; frankly, it’s beautiful and I plan on getting copies as they are data-rich and rendered by an excellent set of cartographers. My concern is the data-richness – this map is detailed, and for DOT or the consultants to not release the underlying data along with the maps would be a sin.
Let me take a step back and explain how I first found out about this project. Dave Heller from SJTPO posted an email to the New Jersey Geospatial Forum discussion list, asking the group if there was any bicycle facility data that was publicly available and more recent than 2007.
Hello:
We have a bicycle/pedestrian GIS layer from 2007. I wanted to find out if people here are aware of anything more recent. Specifically, we are interested in South Jersey. Please let me know if you are.
Thanks.
David Heller
Being the great resource that it is, within 10 minutes another member of the NJGF mailing list, Robert Blash, pointed Dave to the Statewide Bicycle Map project web page.
Take a look at http://bikemap.com/njbike/
NJDOT has a project to map out biking areas in NJ.
Robert Blash
I was in the middle of writing an email to Dave & the list about using OSM data for bicycle facilities when Robert’s email came in, so I took a look at the site. While I was glad that DOT is looking to create a statewide cycling map, I was a little dismayed by what I saw on the site. My email to the list follows:
CloudMade has OSM-sourced data available as ESRI Shapefiles.
http://downloads.cloudmade.com/americas/northern_america/united_states/new_jersey#downloads_breadcrumbs
You can see what bike/ped facilities are in place using OpenCycleMap: http://opencyclemap.org/
If you take a look at Glassboro – http://opencyclemap.org/?zoom=15&lat=39.70289&lon=-75.10368&layers=B00 – You will see the Glassboro-Monroe bikeway and the pedestrian connections throughout campus. Some of our bike racks are on OSM, but not all of them.
Regarding the bikemap.com site, I contacted DOT a few years ago regarding the old Bike Maps that were released, looking for the underlying data. The maps were produced by the RBA Group. DOT informed me that the PDFs were the only deliverable and that DOT did not have ANY geospatial data related to bicycle lanes, routes and facilities. bikemap.com is run by RBA Group. Will this project be no different and community-sourced bike data be locked up by a private consulting firm?
You can register for the site and leave comments. Please take a few minutes and let them know that the GIS data behind the map should be made publicly available. Comment #2 is what deliverables are important; click “electronic file”. For question #4, comments, I left the following:
“Please make sure that all data collected through bikemap.com relevant to the production of the cycling routes and facilities is made available to the citizens of New Jersey by placing the data online under an open data license or released as public domain.”
If this project is funded by both NJ DOT and US DOT, the results of it should be open and accessible.
Peace, love, and open source,
John
Merrilee Torres, from Burlington County, replied to the list mentioning that Steve Spindler Cartography (who owns bikemap.com) is involved in the project and that echoing my concern for public release of the data, as the project managers, RBA Group, solicited the counties for bicycle facilities data.
My understanding is that Steve Spindler Cartography is doing the mapping for the state bike map but yes, RBA is managing it. I do know that they were trying to collect as much source data from Counties as possible which gives even more credence to the idea that the data should be publicly available.
Merrilee J. Torres, GISP
I then replied to Merrilee and the list, expanding on my position on government and open data:
I don’t want to suggest that the State (if it’s even legally allowed to do so) adopt some sort of license like the GPLv3 where derivative works are required to be released under the same terms; open and redistributable. If that were the case, it could be argued that anything sourced off of aerial photos would then need to be released. There’s a massive amount of value in having the State’s data open, however it does seem like the public is getting short shafted when public data gets vacuumed up and then locked away. There is some value-added in performing the work that merits compensation to the consultant, but if the State is the one footing the bill, it should be stipulated that the product is owned by and distributable under whatever terms the purchaser/the State deems fit.
The paper NJ Bike maps are going to be great to have. Let’s face it, while many GIS geeks seem to also be biking/outdoor enthusiasts, the reverse is far from true. The public is going to need the paper maps. If the data is released, there’s great opportunities for the GIS geeks to perform some analysis that either improves the data further or could help influence policy relating to bicycle use in the state. Open government data allows many great ideas and projects to come to fruition; producing data, research and applications far beyond the scope of the original project.
And if the data was already there and freely accessible, Dave Heller would have found it and y’all wouldn’t have been subjected to my open data rants! 🙂
John Reiser
The conversation then took a couple turns back on track, to locate some additional information for Dave, then died out. Then a month or so later, I received notice of the public meetings. On April 24th, I rode my bike to work, checked out a ZipCar and went down to the CCC campus for the public meeting.
The meeting was conducted by two staff members from RBA and a staff person from Baker. After explaining the process and the methodology used to rate the state’s roadways for bicycle suitability, they opened it up to comments and questions. I asked about the intent of the map; “Who is your audience?” was met with a “Yes,” followed with an explanation that they intend the map to be useful to anyone.
I voiced my concern with such a sentiment. Paper maps are not going to serve everyone. While most people cycling for recreation are almost guaranteed to benefit from the map, it’s still in paper form. There’s a cost to print and deliver. And even if you provide PDFs, there’s few opportunities for individuals to print large-format maps without a visit to a printer.

Cycling is a key part of commuting, whether it is the sole mode or used to make connections, like above. About 50 bikes were locked outside of Harrison's Path station on a rainy weekday.
Beyond that, what about those that bike because it is their only available mode of transportation? Are the maps and guidebooks going to be available to them? Are the books only going to be available in English? Take a visit to nearly any suburban chain restaurant and you will see a few bikes locked up in the rear, surrounded by a sea of automobile parking. Those bikes don’t belong to a suburban family of four, they belong to those cooking the meals and washing dishes.
If the data behind the maps are made available, the utility of this endeavor increases exponentially. Paper maps serve a purpose and are nice things to have, but in terms of providing for cyclists, planners, social workers, public advocates, and geeks like me are not going to be able build upon a PDF map. Providing the data in a free (libre, not gratis) form enables so many ancillary players to tap into the resource provided and expand its benefits to a larger audience.

Jersey looks devoid of regional connections on OpenCycleMap. I've personally added some smaller tours and bike paths, but there's much more left to add.
I’m attending the meeting at DOT mainly due to the response I received from the individual from Baker regarding the previous set of bicycle maps. When asked about why the data behind the previous set of maps was not made available, the answer I received was that the maps “were done in Illustrator.” Yes, the set of maps (available to download at no-cost from the link above) were likely modified and aesthetically improved in Illustrator. But only Illustrator? Considering the state has GIS data for the millions of miles of roadway in the state, why was only Illustrator used? Fine, forget the old maps for now – the new maps have the tours available on them, along with all of the roadway condition information. There is no possible way that all of that information was managed effectively outside of GIS. And if it was an entirely Illustrator produced product, why is the State paying consultants to be inefficient?
I was told that the data behind the new maps is definitely GIS data, but that the staff of DOT will ultimately decide if the data will be released. First, of all, I intend to submit an OPRA request for the data if it is not released when the project is deemed complete and the paper maps & PDFs are released. Secondly, why wouldn’t DOT want the data released? They already provide GIS data and maps in multiple forms for any use.
I spoke with Elizabeth Cox from RBA after the meeting and she encouraged me to provide written feedback. I will likely print this blog post (how quaint) and will submit it at the public meeting. I may decide to write something more formal for submission and will update this post to include it if written. At the least, I intend to attend the meeting and directly ask the individuals at DOT what are the future plans for this data. I also encourage you to provide feedback via their contact form. I’ll provide updates after the meeting Thursday.


