Now that our crowdsourced update to New Jersey’s land use map has had some serious contributions – we’re just shy of 20,000 user-contributed points of new (2007-2012) urbanization – I realized that many of these locations are in need of updating in OpenStreetMap.
JOSM is my preferred editor for OpenStreetMap. I find it to be incredibly robust and powerful. I also love that it’s extensible; there are plenty of great plugins and it integrates with web services well. One thing that JOSM supports is WMS and TMS background imagery. I often use the freely-available 2012 imagery for New Jersey as a base for my edits. We’re also using the 2012 WMS for our NJ MAP “Growth” crowdsourcing web app to help identify areas of recent development in NJ. If you haven’t seen the app, check it out. It’s an easy to use app where 2012 imagery is presented along with a black mask derived from the 2007 urban lands in the Land Use/Land Cover data. Simply put, if you see a building on the aerials, click on it and tell us what it is.
Because those clusters of single family housing built post-2007 are not likely reflected in OpenStreetMap, I wanted to see if I could provide some base roadways for the new subdivisions as well as clean up the land use imported into OSM, which was from 2002.
I have a WMS service of the points in the Growth app, served up by GeoServer. GeoServer is also capable of providing the same data in TMS. While I was going to simply add a link to the WMS to JOSM, so that I could see the project’s contributions along side the aerial photo and the OSM data, I realized that it wouldn’t be as useful in the main map interface, because I’d only see the points after I downloaded some OSM data.
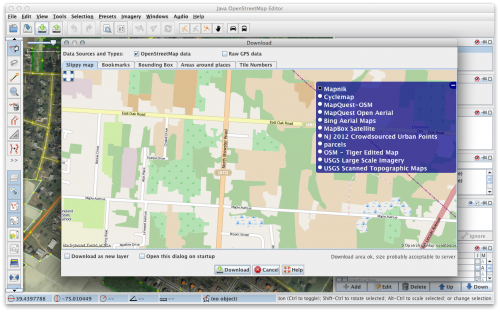
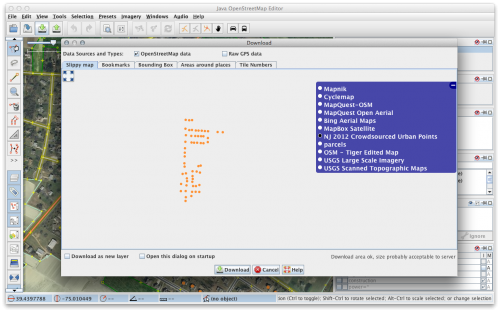
 To help you find your area of interest, JOSM includes several OSM-derived map services through the Download Data window. I did not realize that the list of layers included any TMS layers you added to JOSM. So instead of adding the new urban points from Growth as a WMS, I added them as a TMS. Now, instead of browsing for locations using Mapnik tiles, I can look for clusters of development points.
 Granted, it’s not too meaningful – it’s just the points without any other background information – but it’s easy to find areas that likely need attention.
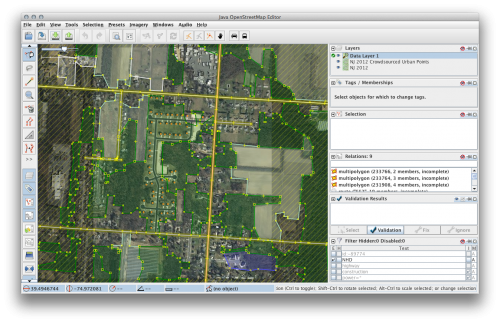
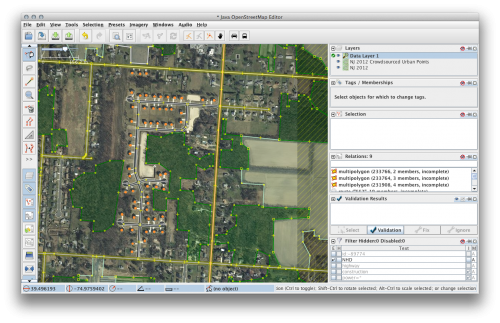
 This area was forest in 2002, but in 2012 is a new housing development. I was able to add the roads of the new development, as well as clean up the surrounding land use.
 Now, I’ll still need to refer to another available source (such as NJ’s road network or our parcel data – both freely available under OSM-friendly licenses) for things like the road names, being able to focus in on areas that need updating in OSM will help us all improve the New Jersey portion of the world’s best free map.
If you want to help update OSM using NJ MAP: Growth as a guide, add the following TMS to JOSM:
tms:http://gis.rowan.edu:8080/geoserver/gwc/service/tms/1.0.0/njmap%3Acrowdsource_points@EPSG%3A900913@png/{zoom}/{x}/{-y}.png
