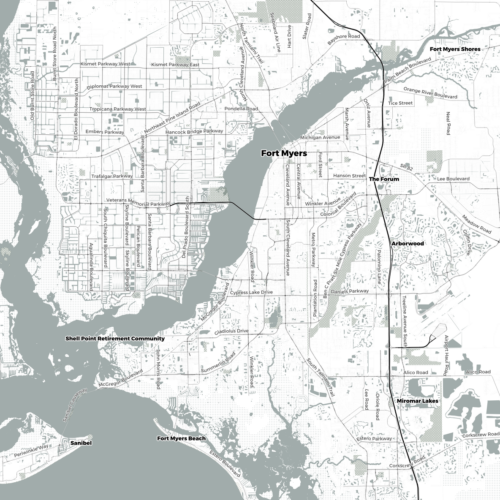
Understandably, the awesome map tiles produced by Stamen Design over 10 years ago have been moved to Stadia and are now a paid service. I have extensively used the Toner Labels service as annotation to aerial photography and as a base map for plotting point features. The projected cost of migration was too great. Over a recent 30 day period, I had approximately 70 million hits to CloudFront endpoint that serves up both GeoJSON parcels and proxied aerial photography. Assuming an even split between the two (each map request gets both parcels and imagery), that’s 35 million requests I would likely make to Stadia. This would likely be approximately $400 per month in additional charges to operate.
When I first received notice back in July, I started to look into a simple, straightforward replacement that I could produce in-house and self host. I also wanted to explore updating the map, as the Stamen-hosted tiles rarely (if ever) received an update with changes from OpenStreetMap. And while I liked Toner, I wanted to see if I could make some minor tweaks to it for my purposes.

Exploring My Options
I looked around at other platforms for rendering raster tiles, and they either were deprecated or functionally dead. I really liked TileMill back in the day and hoped to recreate the look of Toner using that platform, but getting it working in 2023 seemed like too much of a hassle.
One big challenge was getting the look and feel down before throwing a style file to a tile server and having it render a bunch of tiles. OpenMapTiles looked promising and featured a variety of styles that you could choose from, however just getting the rendering to switch styles was a headache and there are issues in the repo highlighting how it’s not straightforward.
I knew that I could come up with a suitable map for tiling using QGIS, so I looked into options exporting the styles from QGIS into a format that would work with a raster map tiler or a system like Geoserver. But seeing that QGIS has a server option, going that route would reduce the likelihood of losing something in translation.
Getting OSM data for use in QGIS
Getting OSM data for a specific area is very easy, as Geofabrik provides region-level OSM files. You can then easily convert them into a SQLite file for use in QGIS by using OGR. For example, to import OSM into SQLite and reproject it into Web Mercator, you simply need the following command:
ogr2ogr -f SQLite florida.3857.osm.db florida-latest.osm.pbf -t_srs "EPSG:3857" -progress
Once I had the PBF files into SQLite, I could add the layers to QGIS. And if you have more than one region to port to SQLite, just add the -append flag to your subsequent OGR2OGR commands.
Designing using QGIS
As I previously mentioned, QGIS is a great open-source desktop GIS that also has a server component. I’d rather make my changes in QGIS to see how it looks at different scales and alongside other data, then have qgis-server render it. The wonderful Anita Graser (aka underdark) has a repo with QGIS styles similar to the Stamen Toner style. I used that as a starting point and continued to work on a style that would suit my purposes.

I added some additional shading for other land use types; golf courses and beaches are definitely landmarks to help orient people, especially in Florida. I also downloaded an OSM-based ocean polygon, as the areas I’m mapping are all coastal and having the ocean appear “blank” was disorienting.
Within QGIS, I have the rendering rules set to change the appearance of the line features to appear only as labels, centered on the line when reaching approximately zoom level 16. This way, the map tiles can be used as annotation on top of aerial photography.
I ran qgis-server and QGIS Desktop simultaneously, so that I could add the WMS-rendered map to Desktop and see how it would appear along with other data elements. Now that I was happy with the result, I wanted to move to tiling the output.
Caching Tiles
Many years ago when I last produced a large array of tiles, I did so using Geoserver and Tilecache. While I could have exported my map styles to an SLD and used that with Geoserver, I was happy with qgis-server and wanted to see if there was something more modern than Tilecache, as that project had not seen an update since the early 2010s.
I found MapProxy, which could act as both a local web proxy for testing as well as a cache seeding tool. After only a short amount of configuration and tinkering, I was able to confirm that the seeding process was working correctly and storing to disk.
Switching to PostgreSQL and Scaling
After kicking off a seeding process at a higher zoom level (e.g. 11) I realized that this process would take very long to generate tiles down at zoom 18 for the regions I needed to render. I started to look for a few places I could optimize things.
First off, I realized that QGIS was the bottleneck – MapProxy isn’t doing the heavy lifting. So how can I speed up QGIS? I tried a couple of things, but what I settled on was shifting to PostgreSQL and scaling up using Docker.
First off, SQLite is very fast. However I wanted to see if I could completely offload the querying and data processing. Moving to PostgreSQL was very easy – spin up a container for the database and then use ogr2ogr to copy the entire SQLite database into a new PostgreSQL database. And as the symbology rules I copied from the repo mentioned above used several LIKEs to identify OSM tags, I could then use trigrams to improve the queries relying on LIKE.
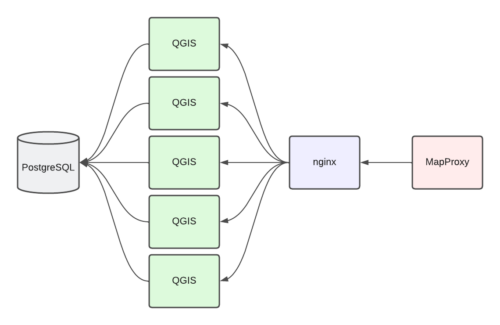
For each MapProxy request, waiting on the responses from QGIS was the blocker. I could scale up the QGIS instances (each talking to the same PostgreSQL database) and perform some of the rendering in parallel. I settled on the following configuration:

As all of these were in Docker containers, it was very easy to scale up from 1 to 3 and then eventually 5 instances of QGIS. By adding --scale qgis=5 to my docker-compose up command would launch 5 instances of QGIS and no other changes were needed. nginx would automatically round-robin requests between the different QGIS instances. I could also monitor the activity using docker stats. Below is modified example of the output, showing the scaled-up QGIS along with memory and network usage.
NAME                           CPU %     MEM USAGE / LIMIT     MEM %     NET I/O
qgis_server_tiles_qgis_1       0.01%     318.1MiB / 31.32GiB   0.99%     10.4GB / 392MB
qgis_server_tiles_qgis_2       16.21%    306.7MiB / 31.32GiB   0.96%     9.23GB / 382MB
qgis_server_tiles_qgis_3       14.80%    306.2MiB / 31.32GiB   0.95%     9.7GB / 373MB
qgis_server_tiles_qgis_4       22.71%    139.1MiB / 31.32GiB   0.43%     11.5MB / 2.44MB
qgis_server_tiles_qgis_5       11.00%    124.5MiB / 31.32GiB   0.39%     6.82MB / 2.1MB
qgis_server_tiles_mapproxy_1   33.23%    770.2MiB / 31.32GiB   2.40%     981MB / 23.8MB
qgis_server_tiles_nginx_1      0.27%     3.305MiB / 31.32GiB   0.01%     14.2MB / 14.6MB
postgresql_postgres_1          0.62%     11.38GiB / 31.32GiB   36.35%    18.4GB / 81.3GB
These processes were run on a VM with 4 vCPU, 32GB of RAM and 1TB of disk. Still, it took about 4 days to run through the entire set of seed regions, creating 16 million tiles taking up approximately 74GB.
Before uploading, I also determined that a tile that was solid-water ended up being 334 bytes. I did not want to upload these tiles, as I had generated far too many of them:
$ find . -name "*.png" -size 334c -print | wc -l
13334861
I hosted the tiles as a static website AWS S3 bucket, in which you can specify an “error” file to be served when a 404 is encountered. I uploaded one of the water tiles to the root of the bucket and then specified that as the file to be returned when a requested file is missing.
Roll Your Own Tiles
After a lot of trial and error, I was able to shift my map services off of Stamen and on to my self-hosted solution. I probably could have done things differently, but in the end I was able to get to a solution that worked well for me.
If you would like some direction and have a similar workflow/end goal in mind, I have packaged up the code that I used to render OpenStreetMap using QGIS Server.
https://github.com/areaplot/qgis_server_tiles
Feel free to use the code as you see fit. Open an issue on GitHub if there are any comments or questions.
Switching to Vector Tiles
Why not vector tiles? Frankly, I’m juggling other work and I want to have a better understanding of building and hosting them at scale before I dive in. Unfortunately, much of the “switch to vector” documents on the web are getting pretty dated and often reference open source projects long abandoned. When I do get my head wrapped around it, I will provide an update (along with code) that will hopefully help someone from this point forward. Also, perhaps this is a backdoor implementation of Cunningham’s Law and someone will show up in the comments and point me to a current, usable reference.
I just recently saw Protomaps via Hacker News and its PMTiles format is most likely my next stop in exploring a vector-based mapping solution.
I definitely want to make the move to vector, as I could likely see big benefits for both the OSM data and the custom property parcel data I host on compression alone. Being able to reliably change styles on both depending on presentation context would be a bonus as well.
